Derived analytics · Indian index options · every minute
The option chain, read the way hedgers must trade it.
Where the chain is positioned, where hedging absorbs or amplifies a move, how much room a session like today usually has — for five indices, computed every minute from option-chain data delivered through each member's own broker connection, and graded publicly at every close. Conditions, never calls.
| Index | Session range | Positioning at the close |
|---|---|---|
| NIFTY Two-way session |
the close landed inside the day's range | |
| BANKNIFTY Two-way session |
the close landed inside the day's range | |
| FINNIFTY Closed near the high |
the move held into the close | |
| MIDCPNIFTY Two-way session |
the close landed inside the day's range | |
| SENSEX on your account |
BSE index · live for connected members |
Built on Vyloka's own research record.
Every figure on Vyloka is derived from option-chain data delivered through each member's own broker connection, NSE's published end-of-day files and Vyloka's own research record — two years of session history per index. Nothing modelled, nothing smoothed, and no market data is redistributed: what you see is a derived value or a historical frequency, with the sample size stated.
- Option-chain positioning for NIFTY, BANKNIFTY, FINNIFTY, MIDCPNIFTY, SENSEX and the second weekly — every session
- Two years of labelled sessions per index, recorded on the founders' own account and kept as research — never served as market data
- Constituent breadth rebuilt for 500+ sessions per index
- Every morning summary journaled, then graded at the close
- Misses published with the hits
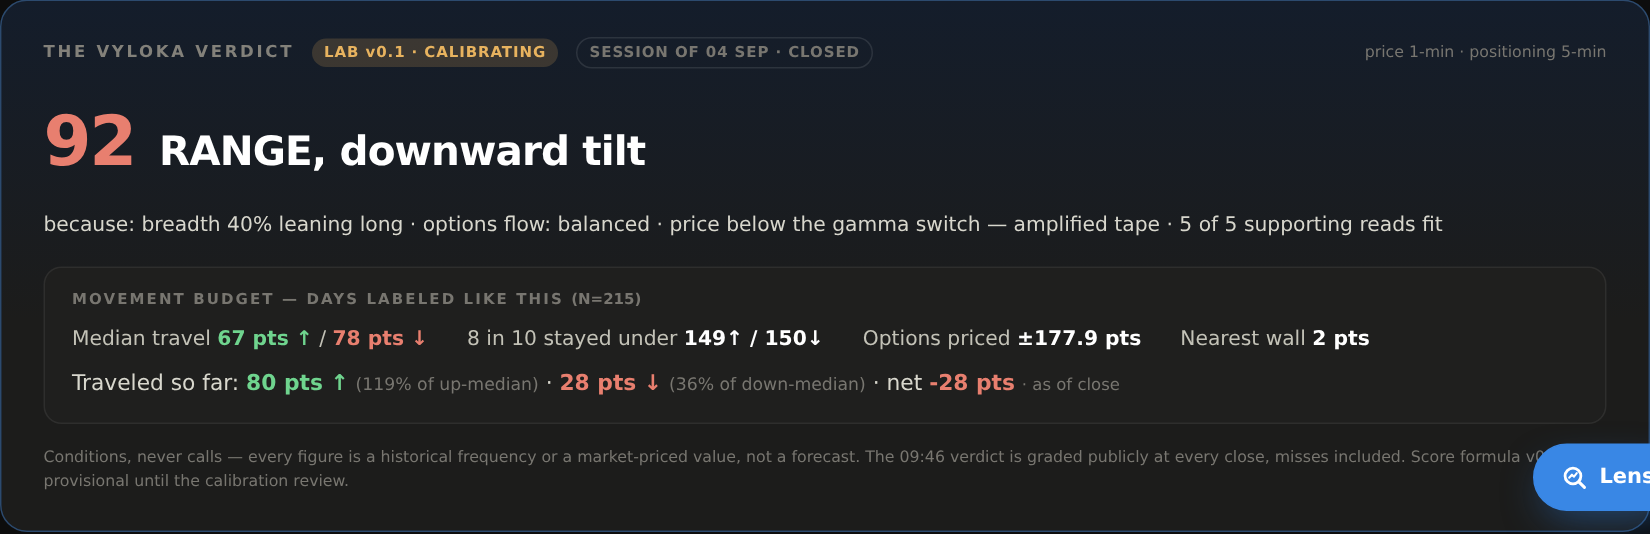 FULL ACCESS · LIVEIntelligenceThe whole stack, live through the session: the Summary, the ten parameters, the hedging map, walls and flow — for every index.Open Intelligence →
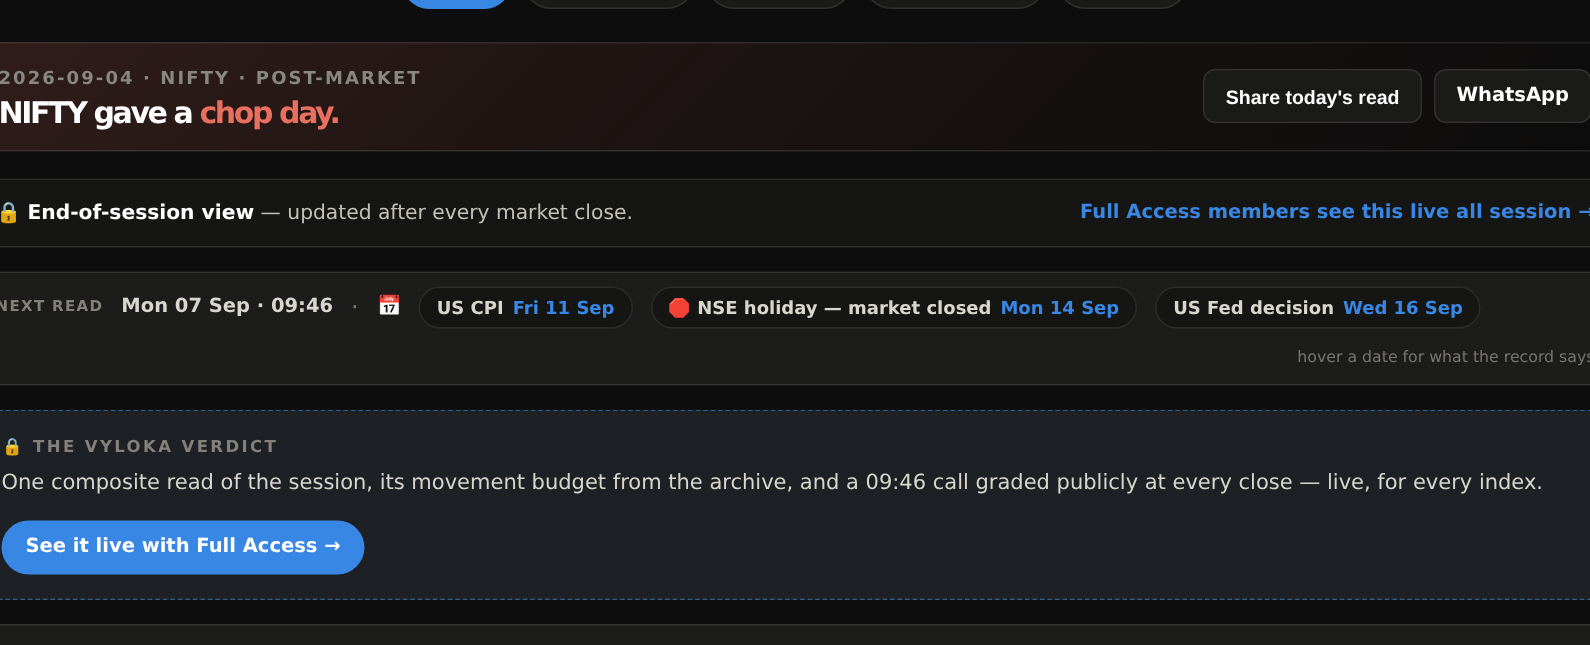 FREE · POST-CLOSEPulseWhat kind of session each index actually had, after every close — the generic conditions stack, shareable in one line.See today's Pulse →
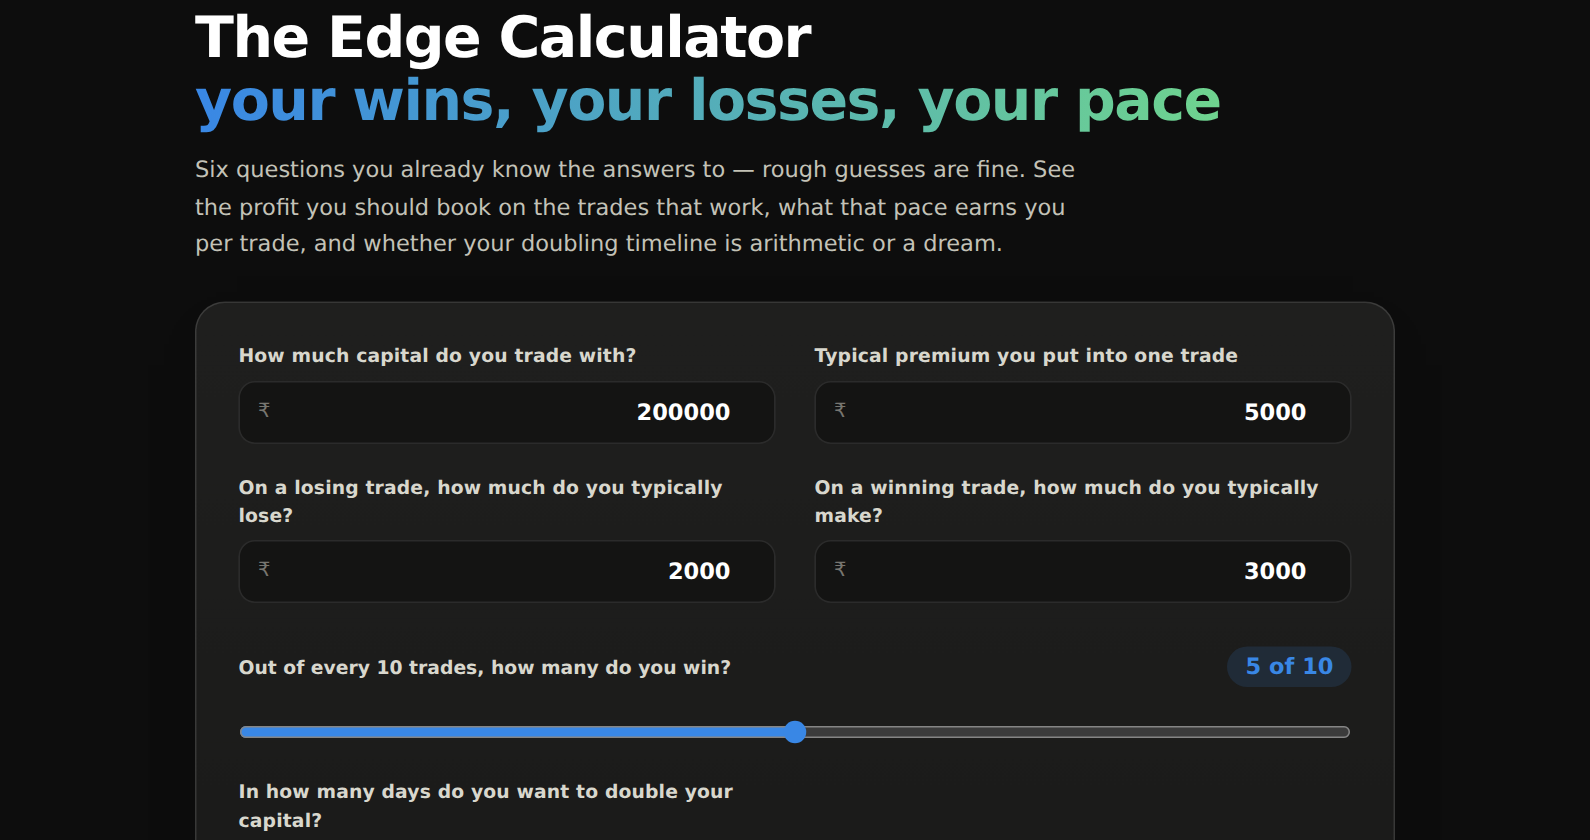 FREE · TOOLEdge CalculatorSix inputs, ten seconds: the profit-booking target your own hit-rate and sizing imply, and the pace at which the record says capital doubles.Run it →
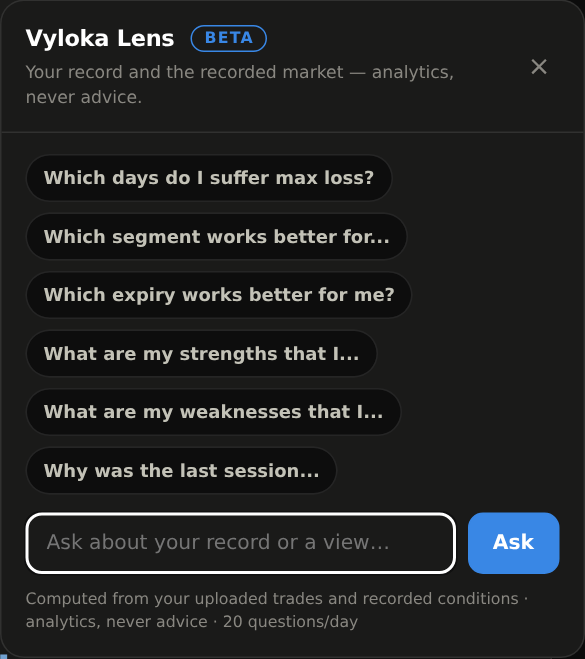 FULL ACCESS · ASKLensAsk the day's reads and your own record in plain words — "how do I do on chop days?" — answered from your data and the engine's, never from opinion.Meet Lens →
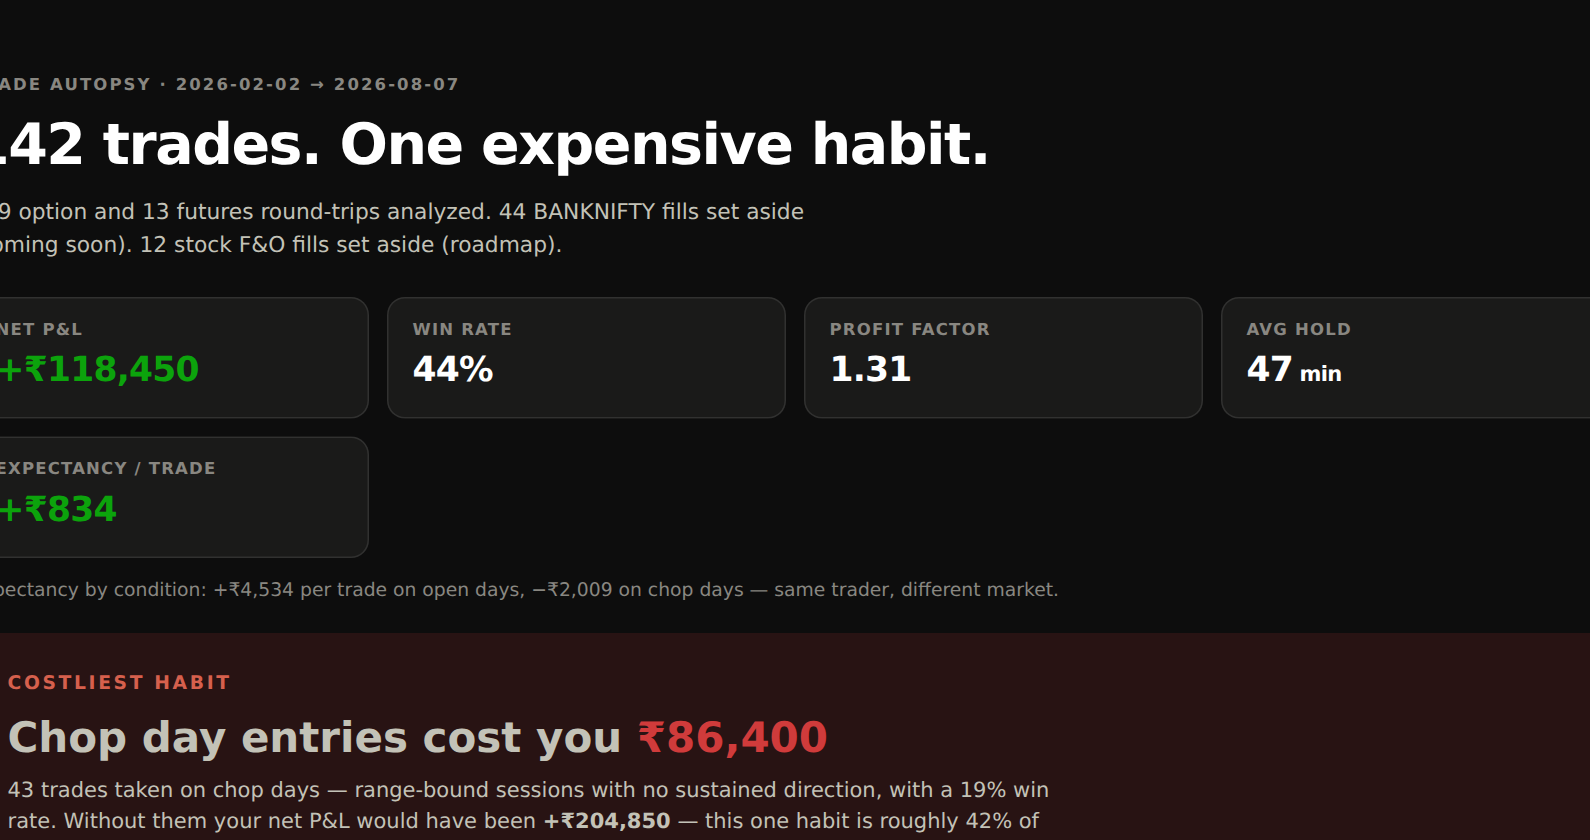 FREE · MINITrade AutopsyUpload a tradebook; Vyloka rebuilds the conditions behind every trade and prices what each one did to your P&L, in rupees. Free mini-autopsy, full report on Full Access.Get the free autopsy →
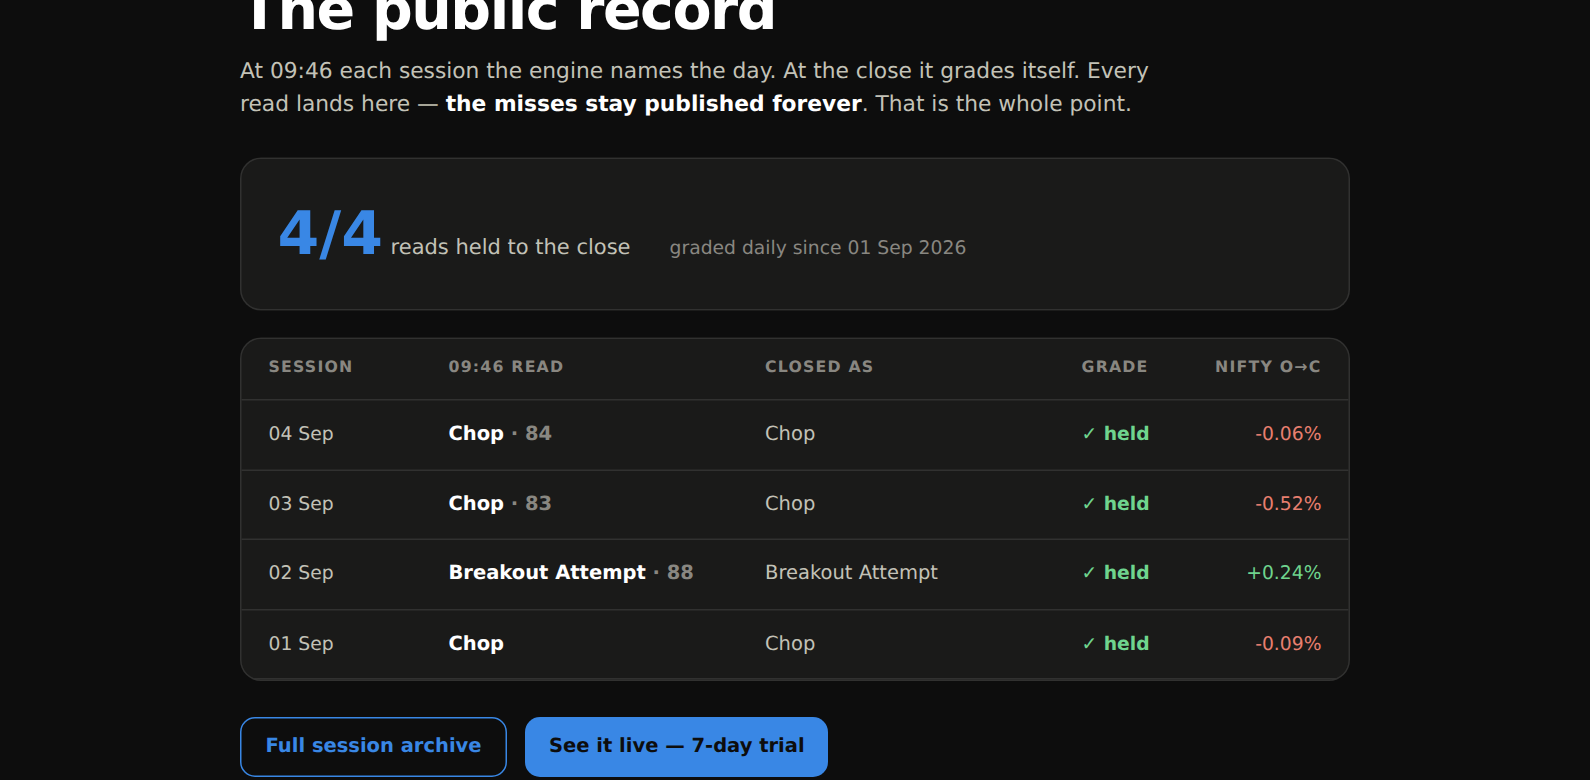 PUBLICThe recordEvery 09:46 summary, graded against the close — held or missed — since the day it went live. The only marketing claim we make is the ledger.Read the ledger →
Full Access — ₹999/month. Private beta, by invite, 7-day trial on every seat.
Live Intelligence on all five indices, the Summary, Lens, and the full Trade Autopsy. Have an invite? It starts a 7-day trial. No invite? Join the waitlist and we'll open a seat.
Vyloka shows market conditions and your own statistics. It never tells you what to buy or sell. Nothing here is investment advice, and Vyloka is not a SEBI-registered investment adviser or research analyst. Every figure is a recorded value or a historical frequency — conditions, never calls.
Derived analytics only — no live market data is displayed or redistributed. Support: support@vyloka.com
Terms · Privacy · Refund Policy · Contact · Session archive · Learn